
Author: Travis Gregar, Anthony Busche, Terry Downey, 3M Center, St Paul, MN 55144
Introduction:
“Can NMR do this?” This is a question that is often asked to folks in the NMR facility at 3M’s Corporate Research Analytical Labs (CRAL). NMR is often seen as a mysterious black box. The limited experience that most people do have with NMR is a brief introduction in undergraduate Organic Chemistry. In this current case, an analytical colleague at one of the 3M manufacturing plants asked about trying to determine the ratio of two components in a coating solution. Initial attempts to measure the component ratios by IR and XRF were met with limited success. Significant errors in the ratio of these two materials result in the product not meeting the desired performance specifications. A multitude of problems related to disposal costs, rejected products, additional testing, and not meeting customer expectations are common consequences. With this background, all roads lead to the fundamental question: could NMR be used to determine the ratio and be adapted as a QC test in a regulated factory environment? In a manufacturing setting, a high field instrument is not possible nor plausible. Besides the high capital expenditures and costly maintenance, a dedicated employee would be needed to make sure the instrument is running and utilized correctly. It was hypothesized that a low field NMR instrument might be able to fit the bill as a QC-friendly alternative.
Part of the qualification of new analytical methods in a regulated environment requires that any data generated by the benchtop NMR- or any other analytical instrument- follow basic qualification protocols. There is often a disconnect between those in the lab environment and those in a regulated factory setting as to what is needed to qualify a new piece of equipment for a specific application. Understanding the unique requirements to determine if the instrument is working correctly, if the data is meaningful, and how the data will be used (i.e. go/no go) is key. Often, the basic data collection for first level decision making is just the beginning. Product developers, engineers, and those in quality control or production take the data a step further and correlate manufacturing conditions, starting materials, and other attributes with product performance. To determine if a new instrument will provide the needed information to support these types of decisions, the following criteria are used: linearity, selectivity/specificity, accuracy, and precision via repeatability and reproducibility. This article will address the process that was followed to ensure that the benchtop NMR met all these criteria. Additionally, sample stability will also be addressed to ensure that sample degradation will not lead to undesired outcomes.
Data Collection and Analysis:
The NMR facility at 3M CRAL routinely collects and interprets NMR spectra in support of R&D, competitive product analysis, and manufacturing support for all of 3M. Fundamentally, the NMR lab at 3M answers two questions- “What is it?” and “How much is there?”. Developing new NMR methods to help 3M advance is an expectation for the members of this lab facility and working with low-field NMR instruments is a part of this mission. When this opportunity arose, the question posed seemed like any other that comes through the facility. An attempt was made to answer the question- “Can this be done?”
Before any NMR work could proceed on a low-field instrument, a good understanding of the NMR spectrum for the coating solution was needed. Ensuring that the peaks related to the two components in the coating solution were not overlapped with each other or other materials in the solution is the bare minimum to explore the feasibility or utility of NMR in this application. Having baseline resolution between peaks is ideal for the most accurate integral values and essentially addresses the selectivity and specificity as mentioned above. To this end, the initial proton NMR spectrum of the coating solution at 500 MHZ was evaluated and is shown below in Figure 1. Identification and confirmation of the peaks of interest are annotated as component A, component B, and solvent. Clearly it appears that the proton NMR spectrum meets the initial qualification that there is enough resolution between the peaks for accurate integral values.
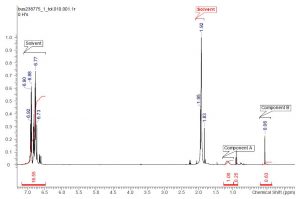
Figure 1: 500 MHz Proton NMR spectrum of coating solution
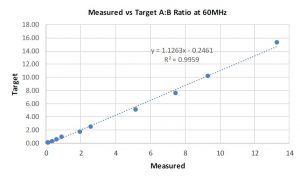
After ensuring the peaks do not overlap, the next step is to ensure the linearity of peak ratios between the two components of interest. To this end, samples with different ratios of component A and component B were prepared ranging from roughly 0.1 to 15, which encompassed the projected range of use for the desired coating solution. Using individual raw material components of the coating solution, gravimetric preparations were made in the desired ratio range with consistent percent solids across all samples. NMR spectra were collected on each sample at 500 MHz. Proton integral values were collected consistently for each component, from which mol % and weight % values were calculated, followed by a calculated ratio of the two targeted components. Graph 1, shown below, compares the targeted as prepared values (gravimetric) of the ratio of compounds and those measured by NMR. Initial attempts at confirming the ratio of the two components at high field appeared promising as the experimentally determined ratio showed good agreement with the gravimetric preparation. Based upon the initial success of the data at 500 MHz it was decided to collect NMR spectra of these samples at low field and compare the results.
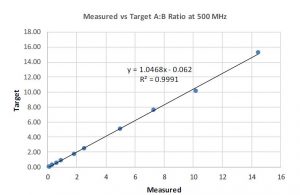
Graph 1: 500 MHz Data
Low-field NMR required a back-to-basics approach to interpreting NMR data. Overlap between peaks and dealing with 13C satellites are some of the biggest concerns. If enough resolution for the peaks of interest is achievable then the implementation of low field NMR methods should be possible, again addressing the selectivity/specificity requirement above. As such, a proton NMR spectrum for the coating solution at 60 MHz is shown in Figure 2 with comparable annotations from the 500 MHz NMR instrument. Despite a slight overlap between the peak of interest for component A and a solvent related peak, the investigation initially seemed reasonable to pursue. Proton NMR spectra of the same series of samples with different component ratios were collected at 60 MHz and graphed. The correlation between the gravimetric ratios and the calculated ratios via NMR is shown in Graph 2. Initial observations suggested that the NMR data at 60 MHz is linear when comparing the gravimetric data to the NMR calculated data. The biggest surprise was the correlation was linear given the peak overlap. It is believed that the consistency of the integral regions even with a slight overlap is key to these values. A rough approximation of the influence of this solvent impurity using the higher resolution 500 MHz NMR data is calculated to be roughly 5% of integral value for component A.
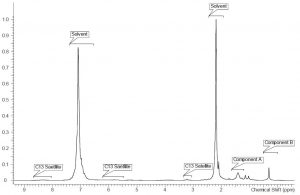
Figure 2: 60 MHz Proton NMR of coating solution
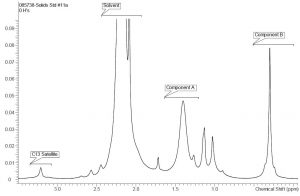
Figure 3: Aliphatic region of 60 MHz Proton NMR of coating solution from Figure 2
Graph 2: 60 MHz Data
As work progressed, an additional opportunity arose at the manufacturing site. It was hypothesized that the NMR data might be used to monitor the percent solids of the coating solution. As part of a standard method, a gravimetric procedure and calculation for measuring percent solids were performed to ensure that the correct amount of material is present after drying. While not complicated, the gravimetric method takes significant time relative to a possibly much faster method. In most manufacturing environments, time is money. It was reasonable to pursue the NMR method to tests its validity. To determine if measuring the percent solids by NMR was possible, a series of solutions were prepared from the coating solution raw materials, with differing levels of total solids. Proton NMR spectra were collected on each sample to compare to the measured percent solids with the gravimetric drying test method. At both 500 and 60 MHz the NMR data looked promising based on the correlation of the measured % solids by NMR and the % solids using the gravimetric dry down method in Graphs 3 and 4.
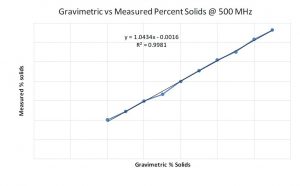
Graph 3: Comparison of % solids data between NMR and gravimetric methods at 500 MHz
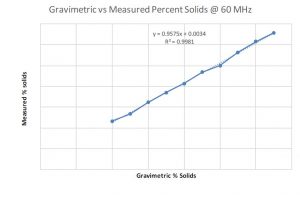
Graph 4: Comparison of % solids data between NMR and gravimetric methods at 500 MHz
Based upon all the generated data correlating the different ratios between samples the low-field NMR instrument appeared to be capable. A reasonably linear correlation was obtained. So far, the NMR data at 500 and 60 MHz for the coating solutions appeared to meet reasonable qualification for linearity and selectivity/specificity. To further qualify the NMR method, accuracy and precision via repeatability and reproducibility were addressed specifically focusing on the data at 60 Mhz. To qualify accuracy, nine samples with three replicates were prepared for NMR analysis at both 500 and 60 MHz. Both the ratio of component A, B, and percent solids were tested. Average values for each were calculated along with % RSD. For our situation it was decided that a % RSD of less than or equal to 10% passes. Chart 1 below summarizes the NMR data at 60 MHz.
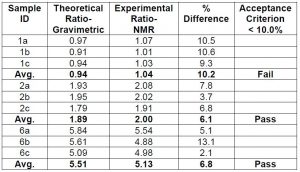
Chart 1: Comparing the accuracy component ratios of coating solutions using NMR data
The NMR data indicates that at the lower component ratios the NMR data did not pass the qualification requirements. It is possible that the slight overlap of the additional peak when measuring the integral for component A is starting to have a larger influence and thus changing the ratio values. Thus, the NMR data indicates that the method is not good for samples used or prepared at lower ratio values.
Accuracy for percent solids was also measured with the same samples as shown in Chart 2 below.
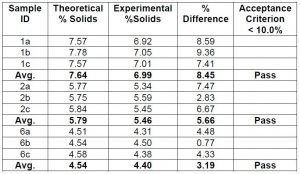
Chart 2: Comparing the accuracy of percent solids of coating solutions using NMR data
The NMR data indicates that the accuracy is good for the measurement of the percent solids by NMR and would qualify as a new test method. However, comparing the data obtained from the traditional gravimetric method to measure percent solids to the NMR calculated data suggests that the accuracy of the NMR method is not as good as indicated in Chart 3 below. Further work is needed to justify the switch to using NMR data for percent solids.
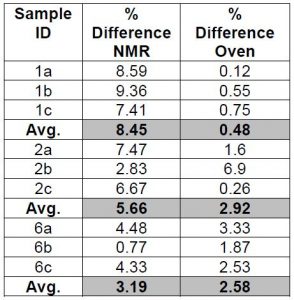
Chart 3: Comparing the measurement of percent solids of coating solutions vs the NMR data verses a gravimetric/dry down oven method
To qualify the benchtop NMR for precision via repeatability and reproducibility, one coating sample was prepared and analyzed six times to show consistency of the component ratio and percent solids. For each data collection, the NMR tube was removed from the NMR and repositioned using the NMR depth gauge. A summary of the repeatability is shown in chart 4 below and appears to indicate that repeatability is quite good.
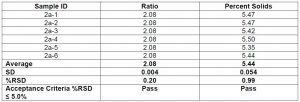
Chart 4: Comparing the repeatability of percent solids and
component ratio of coating solutions at 60 MHz
The reproducibility requirement compares the data for both component ratio and percent solids at two different locations. As the 3M Corporate Research Analytical Lab will serve as the backup for the instrument located at our manufacturing facility, the data are compared between the two locations. For this application it was decided a % RSD of less than or equal to 15% is considered a pass. Chart 5 below summarizes the comparison between the two locations, of component ratios and percent solids for three samples in triplicate. The data suggests that the reproducibility of data between the two locations meets the required specification.
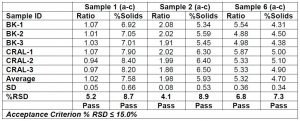
Chart 5: Comparing the percent solids and component ratios of coating solutions in triplicate between two instrument locations
Long term sample stability of the coating solution is a concern that needs to be addressed. For example, when the coating solution is prepared, data needs to be collected that ensures that there are not any side reactions, decomposition of one or more components, or evaporation over time. This is especially important if the benchtop NMR in the manufacturing facility is down. Making sure that shipping the sample to the 3M Central Research Analytical Lab will not result in changes to the sample is critical, specifically any temperature fluctuations that may be experienced during shipment. To monitor sample stability, one coating solution was prepared and placed into a NMR tube. Over a period of nearly a week the composition ratio and % solids were monitored for any changes. As shown in Chart 6 it appears that there does not appear to be any significant changes in the sample. To date- sample stability continues to look good even at 4 weeks.
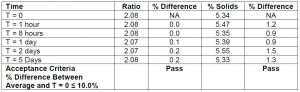
Chart 6: Comparing the percent solids and ratios of coating solutions over increased time lengths
Conclusions:
The benchtop NMR data collected to test for selectivity/specificity, accuracy, and precision via repeatability and reproducibility were shown to meet the qualification requirements for introducing the instrument into a manufacturing environment for measuring component ratio and percent solids. The sample in scope also appears to be stable under long term storage. In the manufacturing environment the NMR system has been configured to automatically collect the NMR data via automation software to make the process on the production floor as easy as possible. We can collect the NMR data, process, phase, reference, integrate peak regions, transfer peak integral values to a spreadsheet where basic math is performed to make NMR use as simple as possible. Implementation of this process will decrease product variability, reduced line downtime, and allow for setting specifications that will better facilitate process control. Long term, certifying the software as 21 CFR Part 11 compliant is mandatory.